
Live Widgets
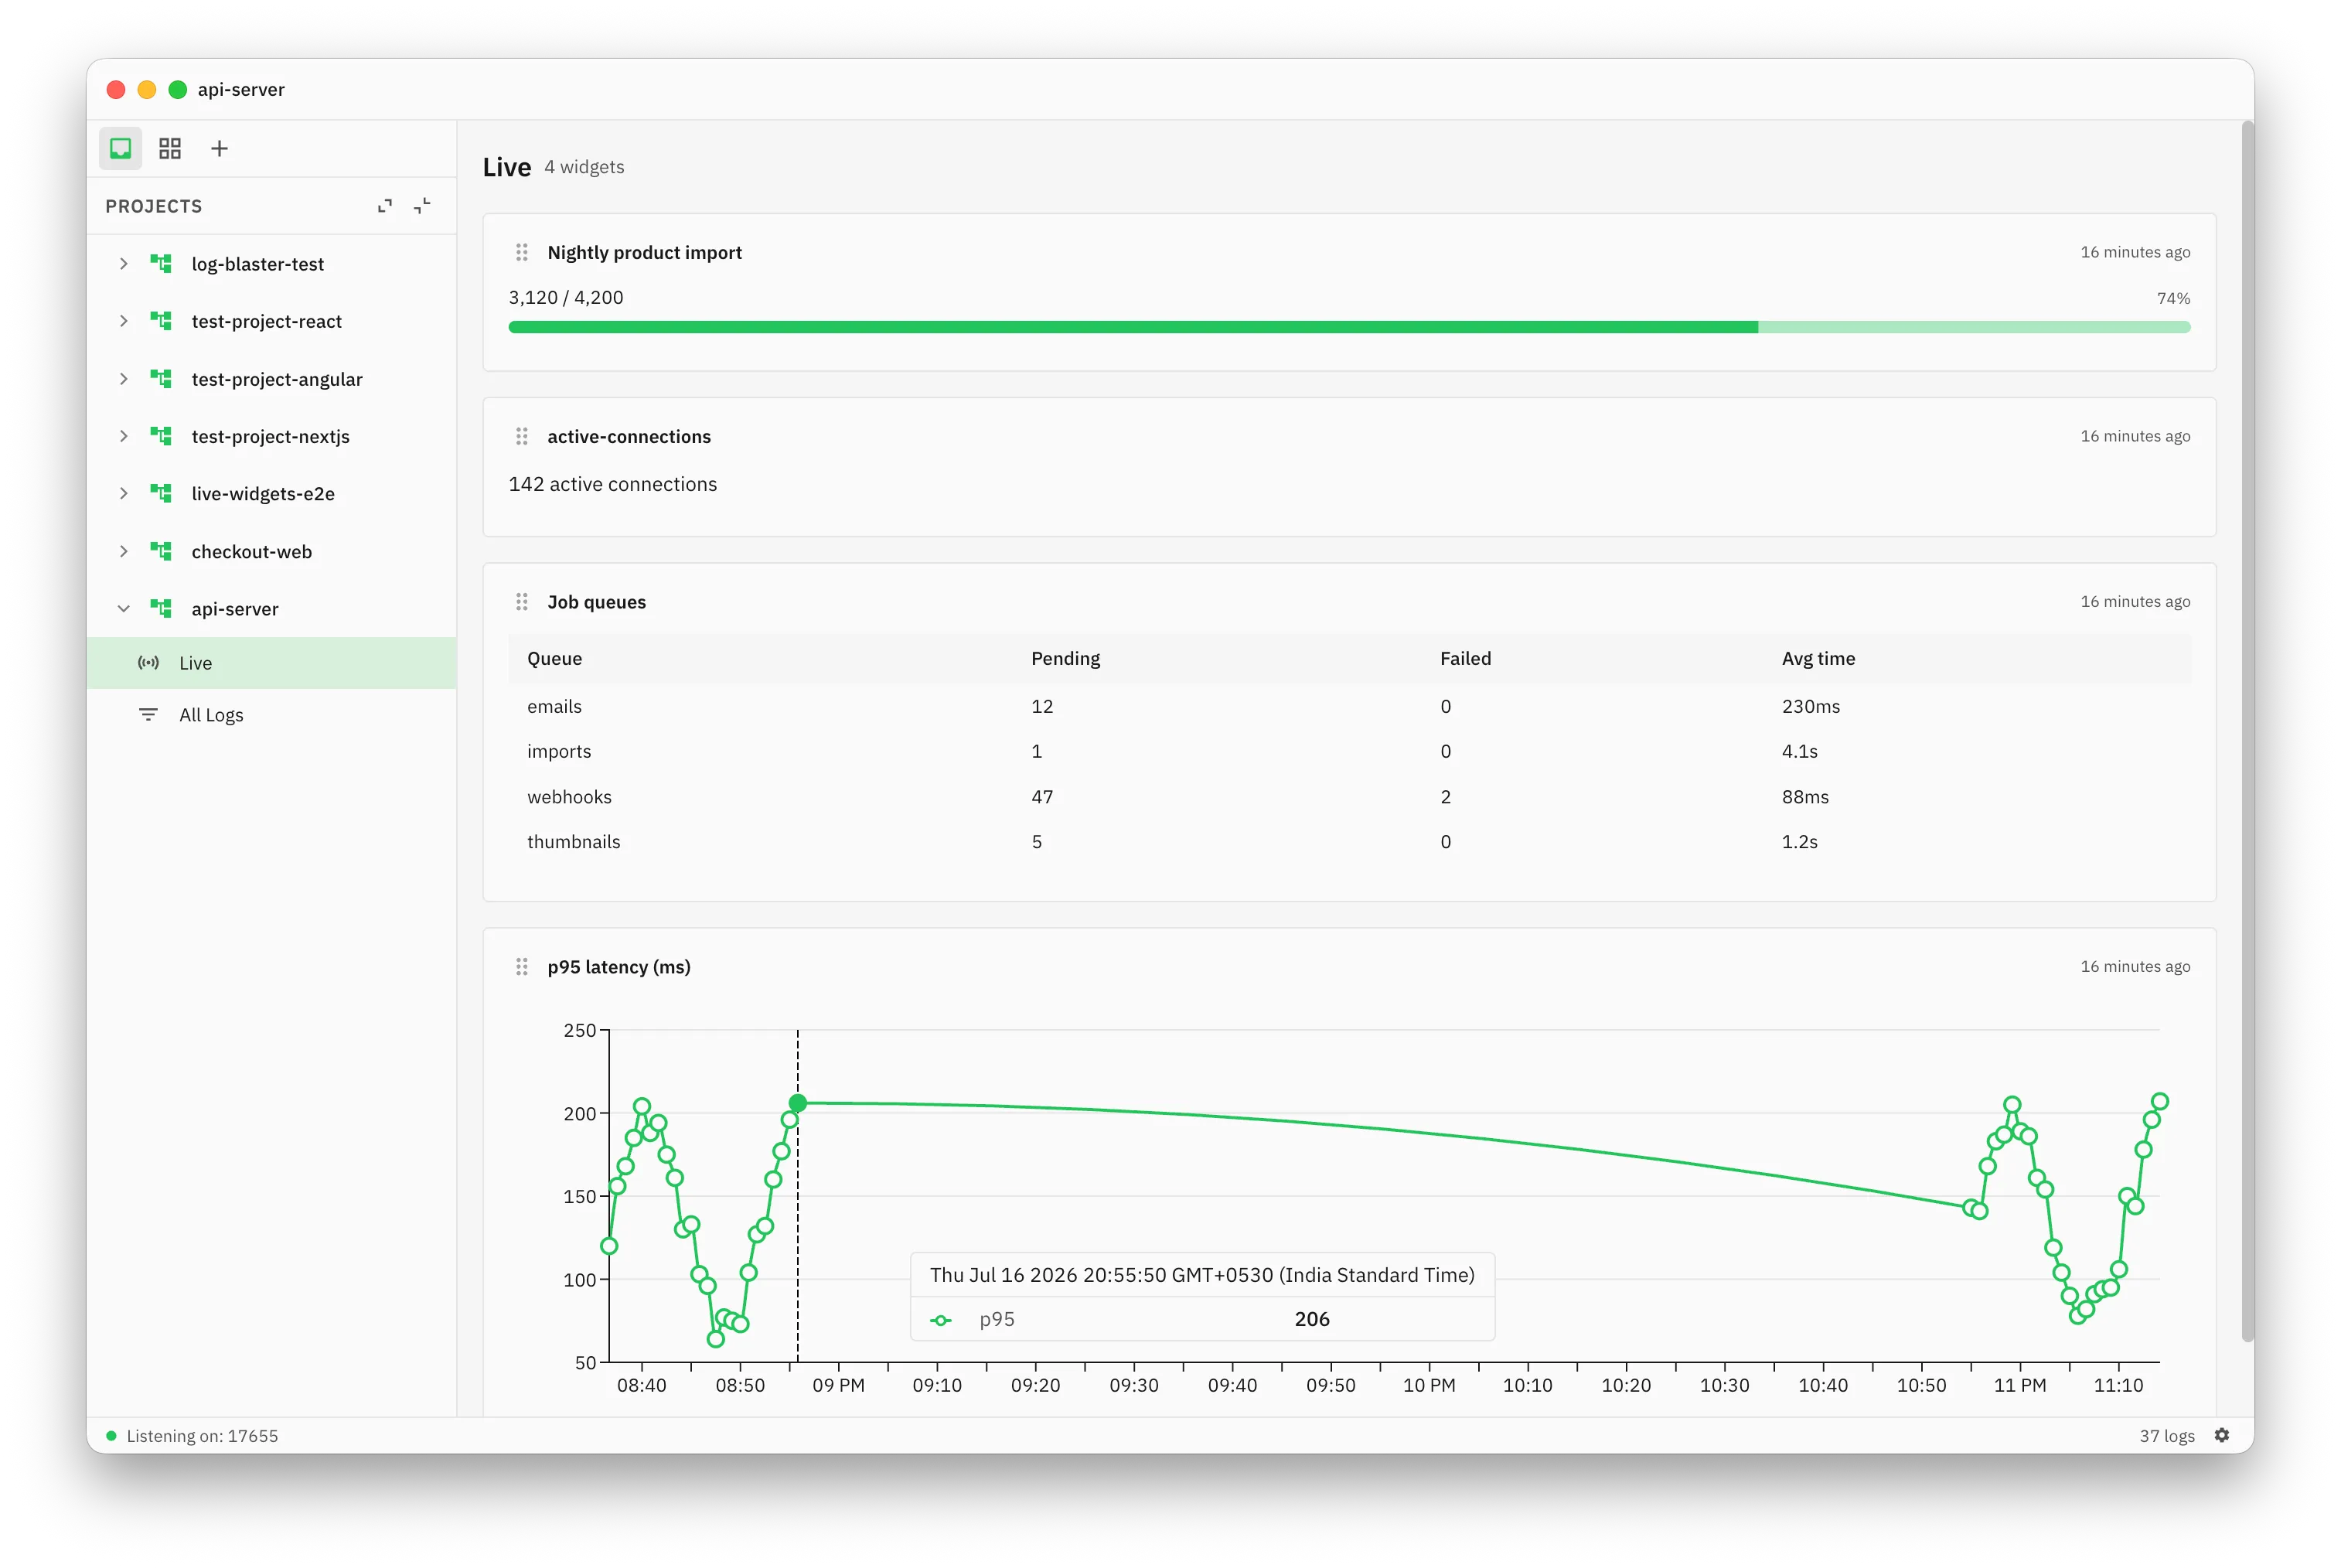
Live widgets let you push real-time values into the desktop app instead of just log lines. A single card showing the current step of a batch job, a progress bar, a table of results, a chart of throughput — all driven by regular SDK calls, no dashboard config required.
Think of it as a lightweight console.log for numbers and progress that you actually want to watch update live: the progress of a batch job, live metrics during a load test, a counter ticking up during a migration.
Requires @gunsole/core >= 0.3.0.
Quick example
Section titled “Quick example”import { createGunsoleClient } from "@gunsole/core";
const gunsole = createGunsoleClient({ projectId: "my-app", mode: "desktop" });
for (let i = 0; i <= items.length; i++) { gunsole.liveProgress("import-job", { label: "Importing", current: i, total: items.length, });
gunsole.liveChart("import-job", { label: "Throughput", y: itemsPerSecond, });
// ... process items[i]}Every widget is identified by a liveId — a string you choose. Multiple SDK calls sharing the same liveId and widget type update the same widget in the desktop app. Widgets show up on the project’s Live Widgets page, and a summary also appears as a stat card on the project dashboard.
liveCard
Section titled “liveCard”A single-value card — a number, a status string, whatever you want to keep an eye on.
gunsole.liveCard("active-workers", "12");gunsole.liveCard("active-workers", "8", { tags: { region: "us-east" } });gunsole.liveCard(liveId: string, text: string, options?: LiveLogOptions): voidliveProgress
Section titled “liveProgress”A progress bar with a current/total count and an optional label.
gunsole.liveProgress("import-job", { label: "Importing users", current: 42, total: 500,});gunsole.liveProgress( liveId: string, data: { label?: string; current: number; total: number }, options?: LiveLogOptions): voidliveTable
Section titled “liveTable”A table of rows — useful for showing a snapshot of top errors, slowest endpoints, worker status, and the like.
gunsole.liveTable("worker-status", { title: "Workers", columns: ["id", "status", "processed"], rows: [ ["worker-1", "running", "1204"], ["worker-2", "idle", "980"], ],});gunsole.liveTable( liveId: string, data: { title?: string; columns: string[]; rows: string[][] }, options?: LiveLogOptions): voidliveChart
Section titled “liveChart”A chart that appends a data point on every call — great for throughput, latency, or any metric you want to watch trend over time.
gunsole.liveChart("throughput", {  label: "Requests/sec",  y: currentRps,});
// Multiple seriesgunsole.liveChart("latency", {  chartType: "line",  series: "p99",  y: p99Latency,});
// Reset the series and start overgunsole.liveChart("throughput", { y: 0, reset: true });gunsole.liveChart( liveId: string, data: { chartType?: "line" | "bar" | "area"; label?: string; x?: number | string; y: number; series?: string; maxPoints?: number; reset?: boolean; }, options?: LiveLogOptions): voidDefaults: x is the current timestamp, series is "value", chartType is "line", maxPoints is 500 (oldest points are dropped once exceeded). Pass reset: true to clear the series before appending the new point — handy at the start of a new run.
Update vs. append
Section titled “Update vs. append”The four widget types don’t all behave the same way when called repeatedly with the same liveId:
liveCard,liveProgress,liveTable— coalesce. These represent a single current value. If you call them multiple times before the SDK’s next batch flush, only the latest call wins — the pending value is simply replaced. This makes it cheap to callliveProgressin a tight loop; you’re not paying for every single call, just for what actually gets flushed. Coalescing replacements also bypass the SDK’s rate limiter, since they don’t add new entries to the queue.liveChart— appends. Every call adds a new data point to the series. Nothing is coalesced, since each point is meaningful on its own (that’s what makes it a chart). Chart calls do pay the normal rate-limit cost, so avoid callingliveChartat a rate higher than yourmaxLogRateallows if you want every point to land.
In short: update liveCard/liveProgress/liveTable as often as you want, but treat liveChart calls like any other rate-limited log call.
In the desktop app
Section titled “In the desktop app”Live widgets appear on the project’s Live Widgets page, with a stat card summarizing them on the project dashboard. Widgets can be reordered, deleted, and cleared from the UI.
Options reference
Section titled “Options reference”All four methods accept an optional LiveLogOptions as the last argument:
| Option | Type | Default | Description |
|---|---|---|---|
bucket | string | "live" | Bucket the widget’s underlying entries are grouped under |
level | string | "info" | Log level for the underlying entries |
tags | Record<string, string> | — | Tags merged into the underlying entries |
context | Record<string, unknown> | — | Extra context attached to the underlying entries |